
 ">WeChat
Create scriptscleancache.sh
#!/bin/bash
sync
echo 1 > /proc/sys/vm/drop_caches
echo 2 > /proc/sys/vm/drop_caches
echo 3 > /proc/sys/vm/drop_caches

创建好了脚本之后需要chmod +x cleanchache.sh
Query server memory occupancy, use command:
du -sh /* | sort -nr
The file size is shown by command query from the top, and files of abnormal size are re-entered (e. g. unusual size in Usr file, entering usr, running command: du-sh /usr/* ⁇ sort-nr), which locates and removes documents of an abnormal size, usually resulting in a log not cleaning up server memory deficiencies in time.
An error was encountered when pressure measurements were performed on the Linux server using Jmeter:
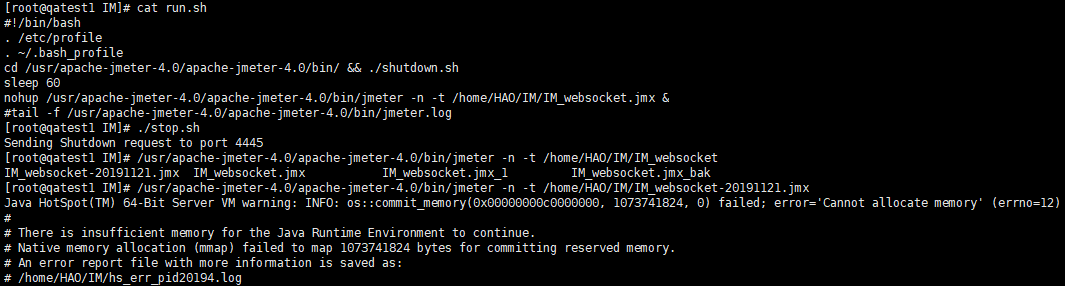 According to the hint here:
Java HotSpot(TM) 64-Bit Server VM warning: INFO: os::commit_memory(0x00000000c0000000, 1073741824, 0) failed; error='Cannot allocate memory' (errno=12)
#
# There is insufficient memory for the Java Runtime Environment to continue.
# Native memory allocation (mmap) failed to map 1073741824 bytes for committing reserved memory.
# An error report file with more information is saved as:
# /home/HAO/IM/hs_err_pid20194.log
Checked the memory, and the results are as follows:
[root@qatest1 IM]# free -m
             total       used       free     shared    buffers     cached
Mem:          8001       7881        120          0          4        416
-/+ buffers/cache:       7460        541
Swap:            0          0          0
It’s really not enough memory. Check it out, there are a lot of unknown services. So we’re going to clean up.
kill -9 `ps aux|head -1;ps aux|grep -v PID|sort -rn -k +4|head | awk '{print $2}'`
If the memory is found to be insufficient after a query has been made, several additional times can be used:
kill -9 `ps aux|head -1;ps aux|grep -v PID|sort -rn -k +4|head -K 50| awk '{print $2}'`
Once again, there are already a lot of memory available:
[root@qatest1 IM]# free -m
             total       used       free     shared    buffers     cached
Mem:          8001       2460       5541          0          5        663
-/+ buffers/cache:       1791       6209
Swap:            0          0          0
(c) The following combination of commands can be used: ps aux ⁇ head-1; ps aux ⁇ grep -v PID ⁇ sort -rn-k +3 ⁇ head linux to access the top 10 processes that occupy memory resources, using the following combination of commands: ps aux ⁇ head-1; ps aux ⁇ grep – v PID ⁇ rt – +3 ⁇ head – in fact two sentences: ps aux_aux_aux ⁇ egyp -vPID ⁇ sort – rn – +3head
You can use commands to check the top 10 memory processes.
View the maximum process of cpu occupancy
Ps. Auxhead-1; pss aux grep-v PID ⁇ sort-rn-k+3 ⁇ head or toop (and then press M, note this is capital)
View processes with the highest occupancy memory***
ps to the head -1;ps to the grep -v PID
One to clean the scriptkill_Xvfb.sh#ps-ef ⁇ grep Xvfb grep – V-V. grep It’s just a little bit of an awk. ‘{print $2}’ | xargs kill –9
Or ps-aux ⁇ grep Xvfb or toop.
This combination of orders is actually the following two sentences:
ps aux ⁇ head-1 ps aux ⁇ grep -v PID ⁇ sort-rn -k +3 ⁇ head, the first sentence of which is mainly intended to obtain titles (USER PID %CPU % MEM VSZ RSSS TTY STAT START TIME COMMAND). The next grep – v PID removes the title given to the ps aux command by removing it from the list of lines that do not contain the three letters of PID and then sorts out the results in order. sort -rn – k + 3 of this command -r is arranged backwards, n is ranked numerically, and -k+3 is sorted for the content of column 3, using the head command to get the default 10 lines (where ⁇ indicates conduit operation).
Supplement: Content explanation
PID: Process ID USER: Process owner PR: Process priority, the smaller the priority is being implemented NINice: Value VIRT: Virtual memory occupied by process RES: Physical memory occupied by process SHR: Shared memory used by process state. S indicates hibernation, R means running, Z means stagnating, N means that process priority is negative % CPU: Process takes over %MEM: percentage of physical and total memory used by process TIME+: Total CPU time taken after process start, i.e. cumulative value of CPU usage. COMMAND: Process start command name
You can use the following commands to check for the most stored K processes:
ps -aux | sort -k4nr | head -K
If there are 10 processes, K = 10 and if the top three, K = 3
Note:The output format of ps-aux is as follows:
USER       PID %CPU %MEM    VSZ   RSS TTY      STAT START   TIME COMMAND
root         1  0.0  0.0  19352  1308 ?        Ss   Jul29   0:00 /sbin/init
root         2  0.0  0.0      0     0 ?        S    Jul29   0:00 [kthreadd]
root         3  0.0  0.0      0     0 ?        S    Jul29   0:11 [migration/0]
In this case, you can see %MEM at the fourth position and sorting from large to small according to %MEM values. Head-K (number of K-Pops, i.e. results for previous output) ⁇ Pipeline symbol, which leads the search out to the command below for subsequent operations. Method 2:top (and then press M, note uppercase)
ps -aux | sort -k3nr | head -K
Method 2: Top (and then press P, note uppercase)
未经允许不得转载:萌萌Apprentissage » Linux Memory Clearing


 linux One Chinese script
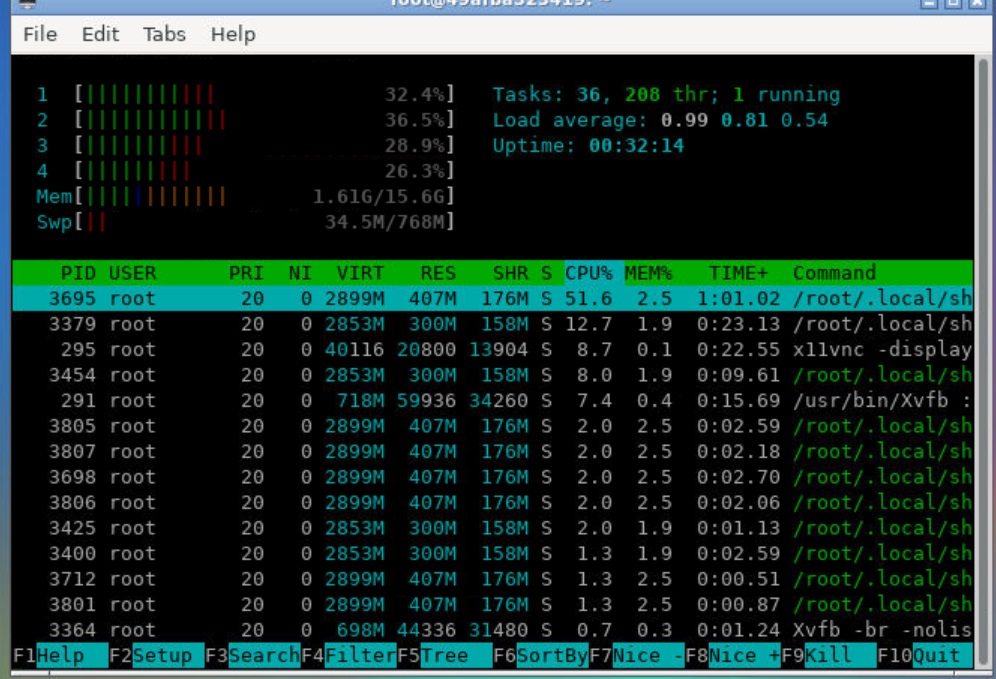 Google shell enable enhanced mode 4 nuclear 16G RAM
 Tmux use tutorial
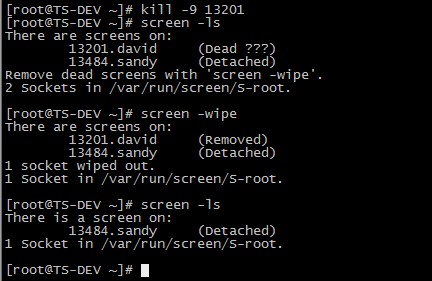 Screen's summary
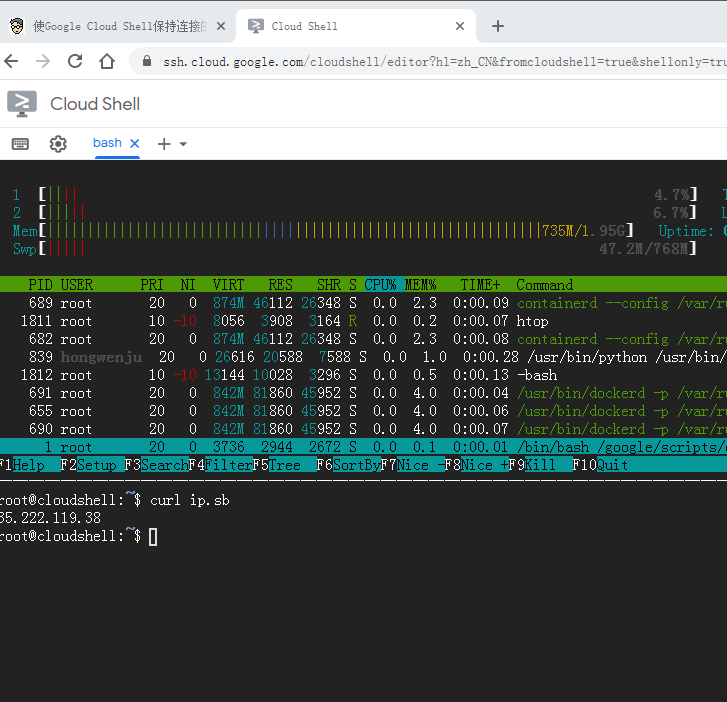 I'm gonna get you a new one, shell.cloud.google on the line.

