 ">微信
">微信How to use the Linux mtr (My Traceroute) command
What is the Mtr command?
Mtr(my traceroute) is a command line network diagnostic tool that provides the functionality of both the ping and traceroute commands. It is a simple and cross-platform tool that prints information about the entire route that the network packets take, right from the host system to the specified destination system. The mtr command takes an edge over the traceroute command as it also prints the response percentage and the response times for all network hops between the two systems.
As a network administrator, you need to learn the usage of the mtr command along with the flags that you can use to customize the output, in order to perform productive network diagnostics. This article explains an in-detail usage of the mtr command along with the examples that will give you a know-how about how to use certain flags with this commands.
We have run the commands and procedures mentioned in this article on an Ubuntu 18.04 LTS system.
Since mtr is a command line utility, we will be using it on the Ubuntu command line, the Terminal. You can open the Terminal application either through the system Dash or the Ctrl +Alt+t shortcut.
Usage of the Mtr Command
1. View traceroute report in real time
The basic use of the mtr command is to view the traceroute report for a remote machine. All you need to to do is provide the domain name or IP address of the remote system with the mtr command and the output will display the traceroute report in real time. When you are done with viewing the report, you can quit the command either by hitting q or the Ctrl+C shortcut.
Display Hostnames
The following syntax of the mtr command displays the hostnames in the traceroute report.
Syntax:
$ mtr [domainName/IP]
Example:
$ mtr google.com

Display Numeric IP addresses
When you use the g flag with the mtr command, it displays the numeric IP addresses instead of the hostnames in the traceroute report.
Syntax:
$ mtr -g [domainName/IP]
Example:
$ mtr -g google.com

Both hostnames and numeric IP addresses
When you use the b flag with the mtr command, it displays both the numeric IP addresses and the hostnames in the traceroute report.
Syntax:
$ mtr -b [domainName/IP]
Example:
$ mtr -b google.com

2. Specify a limit for the number of pings
You can configure the mtr command to quit after printing the traceroute report for a specific number of pings. In the output, you can easily view the number of pings under the Snt column; when Snt reaches the number you specified in your command through the c flag, mtr will automatically exit.
Syntax:
$ mtr -c [n] “domainname/IP”
Example:
$ mtr -c 10 google.com
3. Enable Report Mode
Instead of printing the output of the mtr command on the screen, you can enable the report mode that will instead print the output in a text file. This way you can record the network analysis for later use and observation. All you need to do is enable the report mode through the r flag, specify a ping count for which you want to limit the report through the c flag, and also specify the report filename in which the report will be saved.
Syntax:
$ mtr -r -c [n] “domainname/IP” >”report-name”
Example:
$ mtr -r -c 10 google.com >mtr-report-google
The report is saved in the current user’s home folder by default. You can, however, specify a proper path for the report to be saved in.

Clear output in Report
Adding a w flag with the r flag will enable mtr to print a rather clear and more readable report for the traceroute.
Syntax:
$ mtr –rw -c [n] “domainname/IP” >”report-name”
Example:
mtr -rw -c 10 google.com >mtr-report-google
4. Rearrange the output fields
When you see the output of the mtr report, you will observe that the columns are arranged in a specific default manner. The o flag enables you to re-arrange the output in a customized manner to make it more useful and productive.
Syntax:
$ mtr -o “[Output Format]” “domainname/IP”
The mtr manpage can help you with what options you have while customizing the mtr report columns.
Example:
$ mtr -o "LSDR NBAW JMXI" google.com

5. Specify Time Interval between ICMP ECHO requests
Although the default time interval between each ICMP and ECHO request is 1 second in the mtr command, you can change it by using the i flag to specify a new time interval.
Syntax:
$ mtr -i [time-in-seconds] “domainName/IP”
Example:
$ mtr -i 10 google.com
6. Use TCP SYN packets or UDP datagrams
If you want to use the TCP SYN or the UDP datagrams for requesting mtr instead of the default ICMP ECHO requests, you can do so by using the tcp and udp flags respectively.
Syntax:
$ mtr –tcp “domainName/IP” traceroute -t
$ mtr –udp “domainName/IP”
Example:
$ mtr --tcp google.com
$ mtr --udp google.com

7. Specify the maximum number of hops between the local system and the remote machine
You can customize the maximum number of hops to be probed between your local system and the remote machine by specifying the time, in seconds, with the m flag. The default time limit between two hops is 30 seconds for the mtr command.
Syntax:
$ mtr -m [timeInSeconds] “domainName/IP”
Example:
$ mtr -m 35 216.58.223.78
8. Specify packet size
Through the s flag in the mtr command, you can specify the size, in bytes, of the IP packet for diagnosing network quality.
Syntax:
$ mtr –r -s [packetsize] “domainName/IP”
Example:
mtr -r -s 50 google.com
9. Print CSV Output
The CSV output of the mtr report delimits the columns with a “,”. With the csv flag, you can customize the mtr command to output the report in a CSV format.
Syntax:
$ mtr –csv “domainName/IP”
Example:
$ mtr --csv google.com

10. Print XML Output
The mtr command can also support the XML format for printing traceroute reports. The XML report is a good option for automated processing of the output and can be printed by specifying the xml flag with the mtr command.
Syntax:
$ mtr –xml “domainName/IP”
Example:
$ mtr --xml google.com

11. Accessing the mtr help and man page
Finally, you can get further options for usage and customization of the mtr command by reading its help and man page through the following commands.
$ man mtr
$ mtr --help
After reading this article, you are better equipped with running network diagnostics between your machine and a remote system. You also have an alternative to the ping and traceroute commands, with many more customization options for better productivity and usefulness.
未经允许不得转载:萌萌Apprentissage » linux mtr command

 linux一键中文脚本
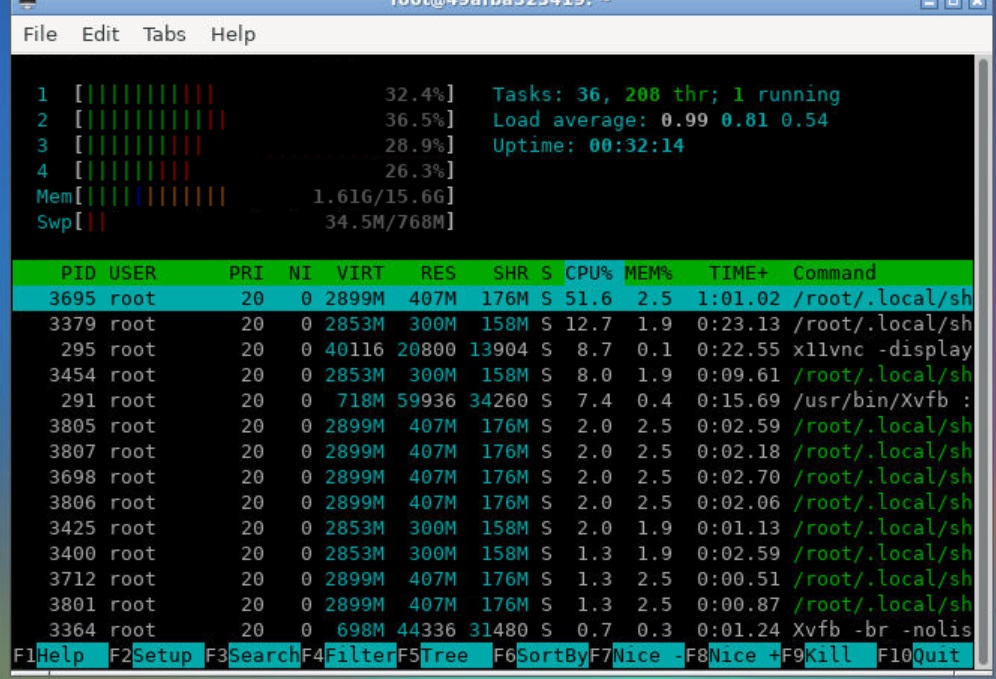 google shell启用增强模式4核16G内存
 Tmux 使用教程
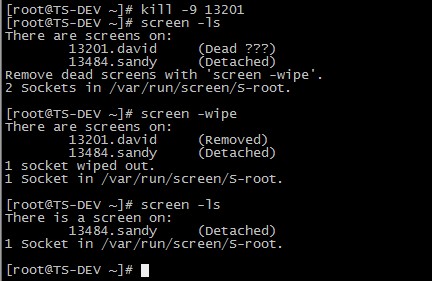 screen简易用法总结
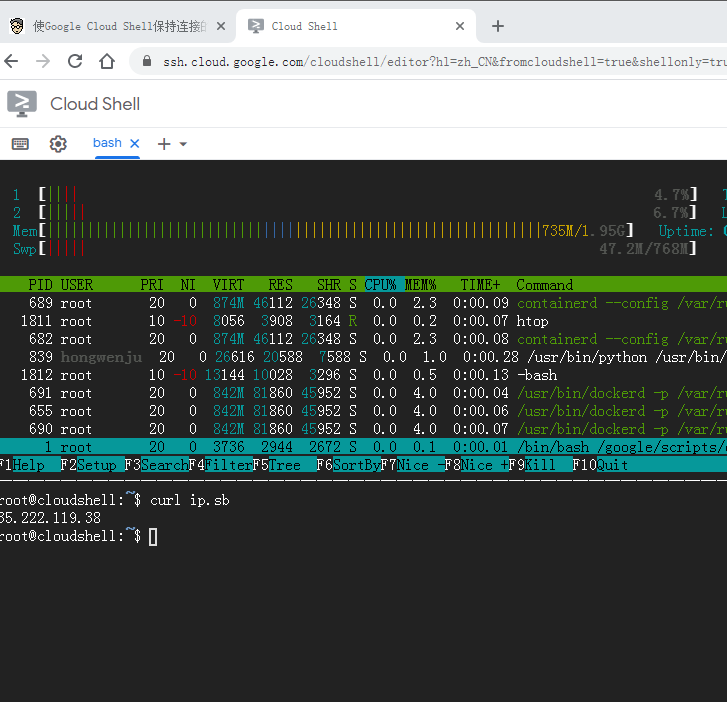 shell.cloud.google保持在线
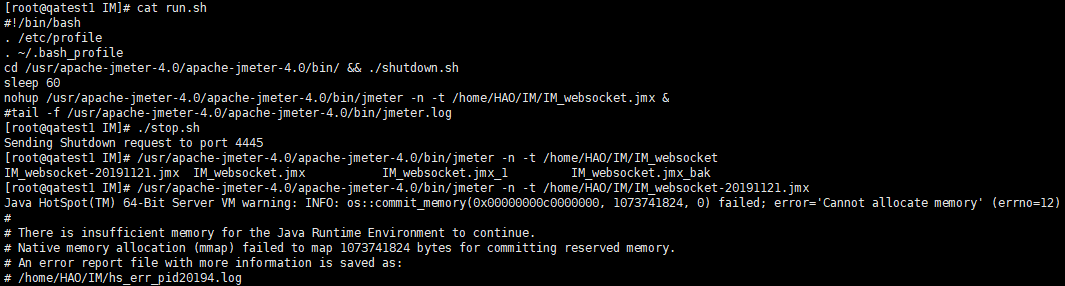 Linux内存清理
